| P | Patient, Population, or Problem |
| I | Intervention, Prognostic Factor, or Exposure |
| C | Comparison |
| O | Outcome |
3 Develop Research Ideas and Questions
Actual footage of my first research meeting in grad school, via GIPHY.
In my experience as a mentor and one time student, one of the most anxiety-producing moments in student life is when a mentor says, “tell me about your ideas”. Why is this innocent prompt terrifying? It might be because we have the wrong understanding of the origin of good ideas.
In his book Where Do Good Ideas Come From?, Steven Johnson argues that good ideas are usually not eureka moments as we tend to imagine. Instead, good ideas are the product of fertile environments where ideas are allowed to “connect, fuse, and recombine” over time.
Two of Johnson’s insights are relevant for us: the notion of the slow hunch and the adjacent possible. These concepts help to explain why generating research ideas can be hard, especially for students.
Watch Steven Johnson talk about Where Good Ideas Come From.
First, the student timeline is often hostile to innovation. Learning and assignments are compressed into semesters, but many ideas need more time to take shape. As Johnson writes:
Most great ideas first take shape in a partial, incomplete form. They have the seeds of something profound, but they lack a key element that can turn the hunch into something truly powerful…They start with a vague, hard-to-describe sense that there’s an interesting solution to a problem that hasn’t yet been proposed, and they linger in the shadows of the mind, sometimes for decades, assembling new connections and gaining strength.
Ideas take time to develop. This is the slow hunch concept. “But I have a research meeting with my mentor next Tuesday and she wants a list of ideas!!”, you say. Breathe, don’t panic. When you recognize that good ideas come from the accumulation of slow hunches, you’ll learn to enjoy the process. Your first idea will be the start of your journey, not the end. Your best ideas might not conform to this semester’s schedule, and that’s OK.
The second insight is related: we’re always sitting on the edge of a breakthrough, but we need access to certain raw materials to unlock this discovery. This is the adjacent possible concept, which Johnson describes as follows:
Searching for the adjacent possible the night before your paper is due, via GIPHY.
Think of [the adjacent possible] as a house that magically expands with each door you open. You begin in a room with four doors, each leading to a new room that you haven’t visited yet. Those four rooms are the adjacent possible. But once you open one of those doors and stroll into that room, three new doors appear, each leading to a brand-new room that you couldn’t have reached from your original starting point. Keep opening new doors and eventually you’ll have built a palace.
Johnson borrows the metaphor of the adjacent possible from theoretical biologist Stuart Kauffman to illustrate the importance of connecting ideas.
The first room is a metaphor for your initial understanding of a new topic. It’s barren because you are new, but your room has many potential doors to open—many lines of research to explore. When you open one door by searching the literature—and by connecting with other colleagues at talks, conferences, meet-ups—more doors appear. Figuring out which doors to walk through (and which ones to close) is a skill that comes with practice. Many literature searches can lead to apparent dead ends, but with each door you open, new hunches form. And when you have opened enough doors:
…one day [your hunches] are transformed into something more substantial: sometimes jolted out by some newly discovered trove of information, or by another hunch lingering in another mind, or by an internal association that finally completes the thought.
This chapter will help you start opening doors. We’ll begin by finding a research problem worth studying—one that matters to you, contributes to your field, and benefits society. Then we’ll explore the three main learning goals in research: describing what exists, explaining why and what if, and predicting what comes next. Armed with this foundation, you’ll learn to craft focused research questions using frameworks like FINER and PICO. We’ll close with hypotheses—what they are, when you need one, and why they must be falsifiable.
So how do you start opening doors? Let’s get practical.
3.1 Find a Research Problem
Watch Tim Tamashiro talk about ikigai.
Every study begins with a motivating research problem. A research problem is your study’s ikigai, its “reason for being”, to borrow a Japanese concept. A research problem should convey a clear reason for being, a clear sense of purpose. Typically, a research problem gets framed as the gap in our knowledge—a gap in the literature.
A defining characteristic of all research problems is that they are potentially solvable (Leary, 2012). To qualify as a research problem, we must be able to use systematic, public methods to gather and analyze data on the problem. For instance, research has shown that insecticide treated bed nets can prevent malaria infections in kids, but in many places kids are not sleeping underneath bed nets every night. Therefore, a research problem to solve might be that we don’t know how to encourage families to adopt and use this effective method of prevention.
Finding research problems worth studying becomes easier with experience. Once you’ve studied a field for a few years, you’ll have cultivated a list of journals, conferences, funders, and colleagues whom you follow to know the latest developments and priorities. As you read and learn, it’ll become easier to spot important gaps that you can help to fill. Likewise, if you’re a practitioner or a policy-maker, your accumulated daily observations will generate ideas.
But let’s assume that this does not describe you today. Where do YOU start?
Students often come to me with a general awareness about a health challenge, not a specific problem or research idea. “I’m interested in mental health”, they’ll say. For students at this early stage of training, I encourage them to adopt someone else’s research problem and jump into an ongoing project to gain experience, rather than develop an independent project.
Aside from soaking in experience, there are steps you can take to expose yourself to new ideas:
- Read the health and science sections of major news publications and set alerts for topics you find interesting
- Look up the national and international professional associations for your research area and subscribe to their mailing lists
- Attend research talks in-person or via online webinars hosted by universities, global health research organizations, or professional associations
- Follow experts active on social media
- Network with local practitioners and policy-makers who have a front row seat to applied challenges and gaps in our knowledge
Not sure what journals to search? Check out Google Scholar’s Top Publications feature.
Above all, start reading the scientific literature. A useful strategy for finding reading material is to visit the websites of the most popular journals in your discipline and browse recent issues. Once you find a few articles of interest, try the following strategy for expanding your search and identifying gaps in the literature worth studying:
A great starting point in the literature is a special type of review called a systematic review. Systematic reviews critically appraise the best available evidence on a topic and synthesize what we know and don’t know. When you start with a systematic review, you let the experts do (some of) the hard work for you. I’ll teach you about these reviews in a later chapter.
- Find the keywords: An article’s keywords make great search terms. Look near the abstract.
- Read the Introduction: A good Introduction will frame gaps in our knowledge of a topic, so pull out a highlighter and get to work.
- Review the Discussion: The Discussion section may hold new leads. Authors use the Discussion to link their study results to the existing literature to demonstrate how the results add to what is known. A good Discussion section will include limitations of the current study and might offer ideas for future research.
- Take note of the cited authors and journals: The Reference section holds clues to your next great find. Tools like Google Scholar let you search for these references and discover where else these citations appear.
Once you start looking, you’ll find research problems everywhere. Your next challenge will be deciding where to direct your attention and energy. I encourage you to favor problems that meet the following criteria:
- Important to you
- Contribute to your field
- Meaningful to society
- Potentially solvable using systematic, public methods (discussed above)
Let me expand on each.
First, the quality of your work will be better if you believe you are working on something interesting and important. Research projects in global health can have a long life-cycle with ups and downs. A genuine interest in solving the problem can help you get through the low points.
Second, when selecting a research problem for study, you should seek to understand from the outset how the answers will contribute to your field. Will your study provide an initial answer to a known problem? Clarify an issue marked by contradictory findings? Support an evolving consensus or provide an important counterpoint to a previously held view? Bring attention to an overlooked issue or apply cross-disciplinary learning to help scholars in your field think differently about a problem? Knowing your study’s purpose will help you to frame your contribution.
The decolonizing global health movement encourages us to reflect on who gets to define the research agenda. If you’re drawn to research problems that require fieldwork with a community that isn’t your own, start by soliciting local perspectives and building a team to conceptualize the problem and design the research.
Not everyone will agree on the third criterion: importance to society. There are many areas of research, especially in the basic sciences, where you can engage in scientifically important work without knowing if or how that work might benefit society one day. Global health is different. There are almost endless applied problems to solve, and you can’t work on them all. In asking to you find problems that are meaningful to society, I’m suggesting that you be intentional. You’ll make many decisions over your career—decisions about training programs, mentors, grant opportunities, collaborators—and each decision has an opportunity cost. Some research problems won’t be a good use of your time and talent (ask me how I know), and we need both to solve big problems. When deciding to pursue new work, stop and ask yourself, “How are we better off if we solve this problem?”
3.2 Identify Your Learning Goal
For a deeper dive into how these three goals map to different statistical approaches, see Lakens’ Improving Your Statistical Inferences.
For a deeper dive into how these three goals map to different statistical approaches, see Lakens’ Improving Your Statistical Inferences (https://ghr.link/lak), freely available online.
Studies seek to describe, explain, or predict. It’s important to understand which goal you are pursuing with your work before you can ask a focused research question and design a study.
DESCRIBE
Every study uses an element of description—but description itself can be the goal. Let’s say you recruit a sample of 100 people who suffer from the same disorder and conduct a trial to estimate the effect of a new drug on a clinical outcome. When you summarize what you know about these 100 people at the time they were recruited, for instance the average age of the group, you’re describing your sample. Descriptive summaries appear in nearly every research article, usually as ‘Table 1’.
But we must distinguish between the use of descriptive statistics—e.g., what is the mean age of these 100 people, the sample—and descriptive research questions. Descriptive research aims to characterize—to describe—a population of interest. This is done through quantitative estimation methods wherein you recruit (or construct) a representative sample and use the data from the sample to estimate how common something is in the population. The core challenge to this type of descriptive research is recruiting a large enough sample that reflects the population of interest well enough to say something valid about the group with sufficient precision to be informative.
Qualitative researchers also seek to describe people, problems, and perspectives, albeit with a focus on depth rather than precise estimation.
Descriptive research is important in every discipline, but especially so in epidemiology. Epidemiologists ask descriptive research questions about people, place, and time. Fox and colleagues define descriptive epidemiology as follows (Fox et al., 2022):
Descriptive epidemiology seeks to characterize the distributions of health, disease, and harmful or beneficial exposures in a well-defined population as they exist, including any meaningful differences in distribution, and whether that distribution is changing over time
That’s a mouthful. Let’s break it down.
Descriptive epidemiology seeks to characterize the distributions of health, disease, and harmful or beneficial exposures…
To “characterize the distribution” of something means to describe how often it occurs. The focus of descriptive studies is frequently a health status (referred to as an outcome), like cancer, or potential exposures, such as environmental carcinogens. But description extends to knowledge, attitudes, practices—what people know, think, and do. For instance, a study might ask, “What percentage of women of reproductive age in Nepal use a modern method of contraception?”
Descriptive epidemiology seeks to characterize the distributions of health, disease, and harmful or beneficial exposures in a well-defined population as they exist
‘as they exist’ alludes to the notion that if your goal is description, statistical adjustment for confounding might be unnecessary or worse.
To ask a good descriptive research question, you must be clear about who makes up your group of interest, or your target population. Your target population is a specific group that you want to make a claim about, such as women of reproductive age in Nepal. Typically you’ll recruit a sample of individuals from this group and use the data you collect to make an inference from this limited sample to the larger group—your target population.
Descriptive epidemiology seeks to characterize the distributions of health, disease, and harmful or beneficial exposures in a well-defined population as they exist, including any meaningful differences in distribution, and whether that distribution is changing over time
Demography is another field that leans hard into description, often focusing on describing trends in births, deaths, marriage, employment, education, and migration.
In addition to describing the group overall, there are often theoretical or programmatic reasons to quantify variation, or differences, in an outcome or exposure across subgroups (people), geographies (place), and time. For instance, you might want to stratify an analysis by ethnicity and race to quantify disparities in outcomes or in access to services. Doing this over time tells you whether conditions are improving, worsening, or staying the same.
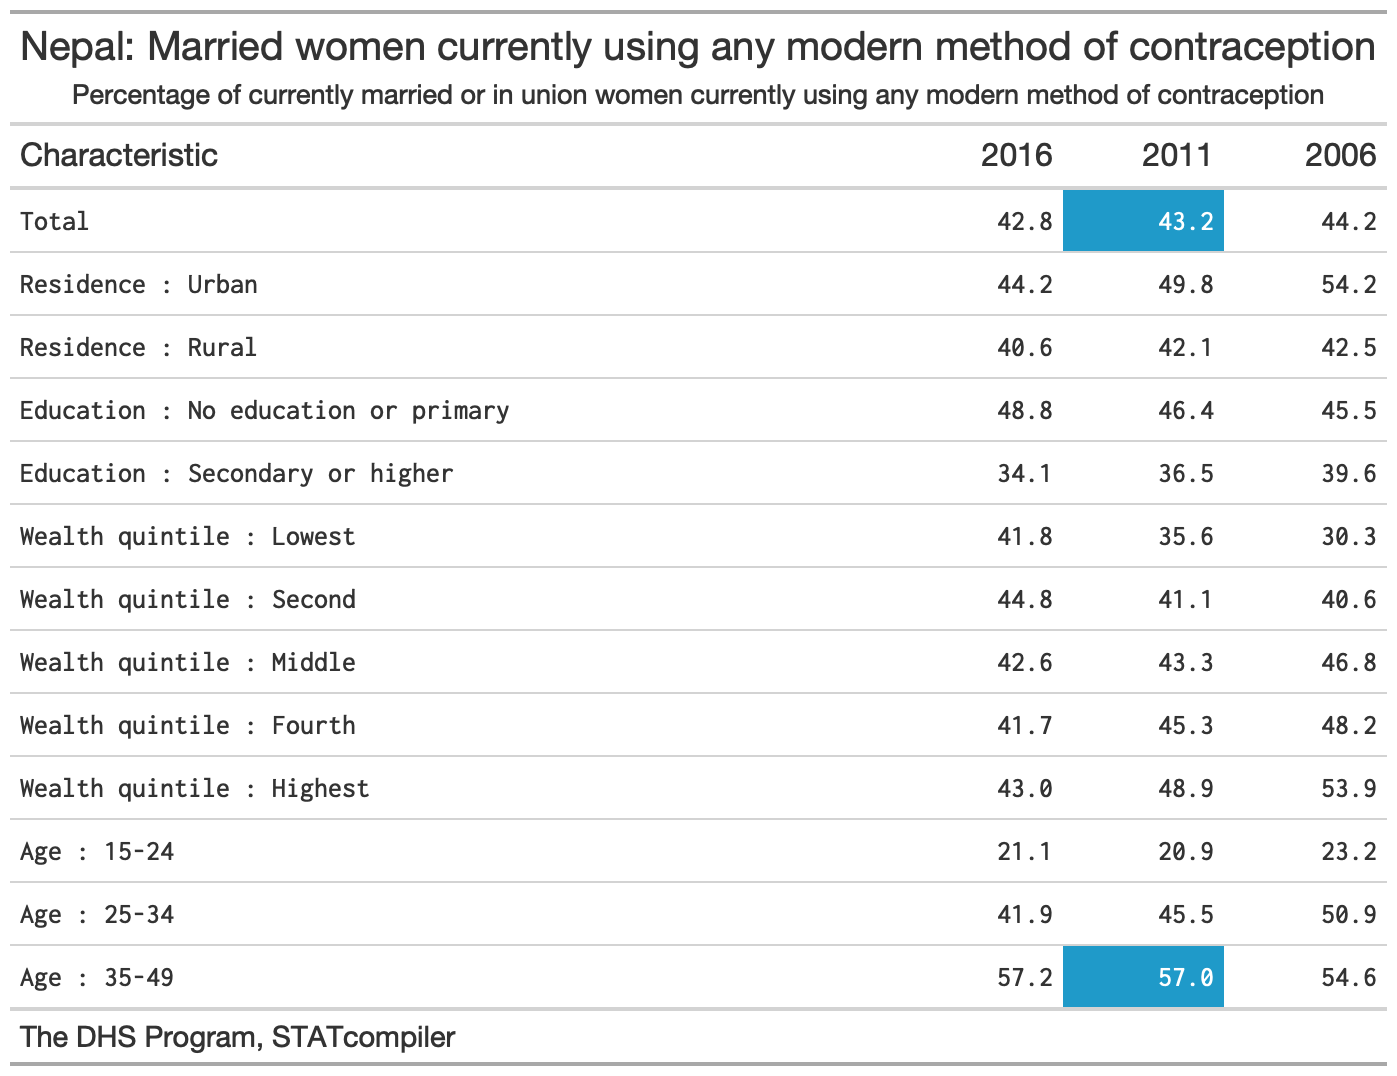
Here’s an example to tie it all together. The descriptive research question is, “What percentage of women of reproductive age in Nepal use a modern method of contraception?”
‘Modern’ methods, such as condoms, implants, pills, are distinguished from (and are more effective than) ‘traditional’ methods, such as withdrawal and the rhythm method.
The Demographic and Health Surveys (DHS) Program has answered this question—and many others!—in more than 90 countries by designing, conducting, and analyzing large, nationally representative surveys on population, health, HIV, and nutrition. For instance, in 2011 DHS researchers surveyed a random sample of 10,826 households across Nepal and interviewed 12,674 women between the ages of 15 and 49 about their health behaviors and preferences (Ministry of Health and Population et al., 2011). They estimated that 43% of married women reported using a modern method of contraception. Stratified by age, modern method use was twice as common among married women ages 35 to 49 compared to married women ages 15 to 24 (see Figure 3.1).
EXPLAIN
Description is essential to science and decision-making related to needs and resources. The result from Nepal suggests that more than half of married women of reproductive age were not using a modern method of contraception in 2010. This is useful to know if you work for the Ministry of Health and are concerned about promoting reproductive health.
But description only gets you so far. You might want to go the next step and ask, “Why is uptake lower among younger women?”, and “What happens if we introduce a policy or program intended to promote contraceptive use?”. Can we explain patterns of modern method use?
Qualitative Inquiry
One way to explore a why question is to ask people. That’s what Navin Bhatt and colleagues did in Nepal to understand the reasons for low use of modern methods of contraception among young people (Bhatt et al., 2021). The research team organized six group discussions and conducted 25 interviews with a diverse mix of informants from one village, including teachers, youths, health workers, religious leaders, and government officials. One woman explained her non-use this way:
My husband works abroad. Last year, when he came home during Dashain (festival), we had (intercourse). Later, he returned to his workplace. Meanwhile, I came to know that I was pregnant, after 3 months. I was shocked to hear that. We already had 3 children; 2 of them were unplanned. I did not have enough information about contraceptive measures in this situation. Had I known about them; I would have used them. —Female, 24 years old
The authors analyzed transcripts with passages like this and reported that young people face numerous barriers to initiating family planning, including a lack of awareness as described by this woman. They concluded the article with several ideas for designing new interventions (programs) to promote modern method use among this group. We’ll return to qualitative methods of data collection and analysis in ?sec-data-collection.
Causal Inference
Another common method for exploring why and what if questions is explanatory modeling, or the use of statistical models for testing causal explanations (Shmueli, 2010). This work also falls under the label of causal inference (see Chapter 7), or what Gelman et al. (2020) define as follows:
what would happen to an outcome y as a result of a treatment, intervention, or exposure z, given pre-treatment information x.
Sometimes researchers ask these questions in the context of an experiment that features random assignment to conditions and active introduction of the treatment, intervention, or exposure. But as Shmueli explains, most often research in the social sciences examines associations between variables in non-experimental data.
Let’s consider two examples of the type of causal inference that we’ll examine in later chapters. Both examples come from Nepal and feature the issue of modern method use.
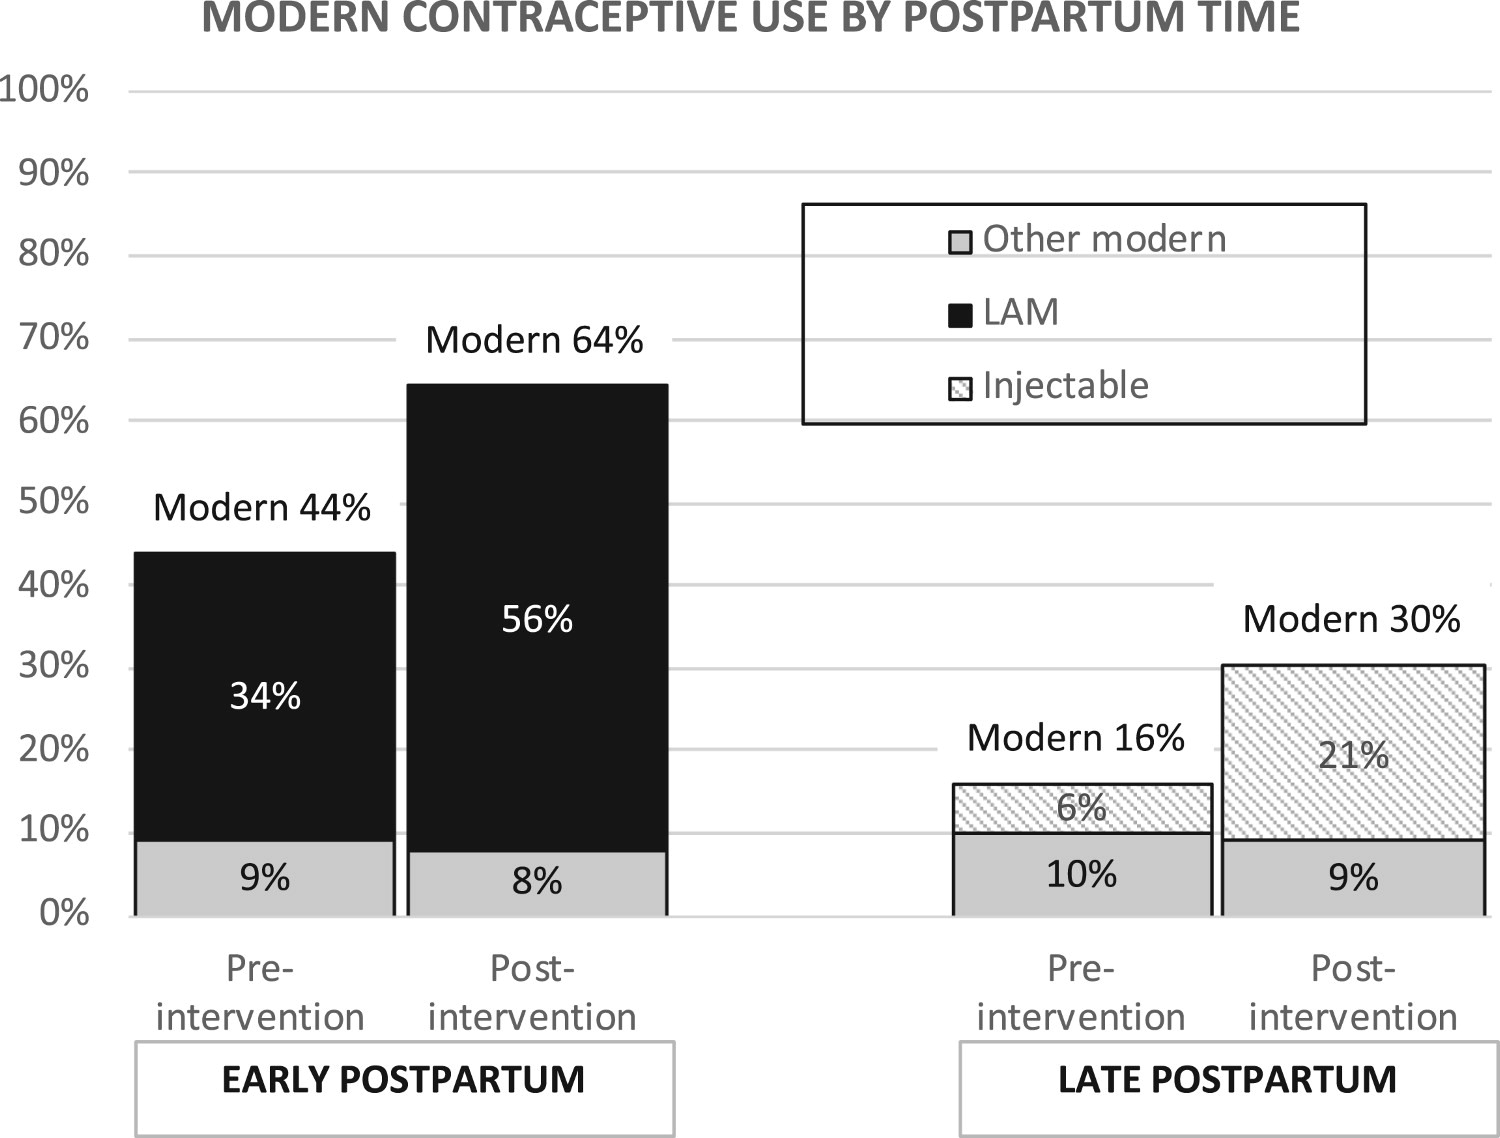
In our first example, Wu et al. (2020) looked at the prevalence of modern contraceptive use in a rural municipality in one of Nepal’s poorest districts before and after a pilot program called Nyaya Health Nepal was implemented. In this program, community health workers conducted home visits with pregnant women and new mothers and offered them contraceptive counseling. The authors reported that modern method use increased from 29% pre-intervention to 46% post-intervention (see Figure 3.2). But as we’ll discuss in Chapter 11, this non-experimental design requires strong assumptions for attributing the observed change to this program.
Research in low-income countries has found that women want to prevent or space their next pregnancy after they have given birth, but most don’t start a method of family planning before their fertility returns. Precisely when women become fertile after childbirth varies and is influenced by factors like breastfeeding, but in most cases ovulation returns before family planning is started. This puts women at risk of an unwanted or mistimed pregnancy. One option to reduce this risk is to have an intrauterine device, or IUD, inserted immediately after delivery of the placenta or within the first month postpartum.
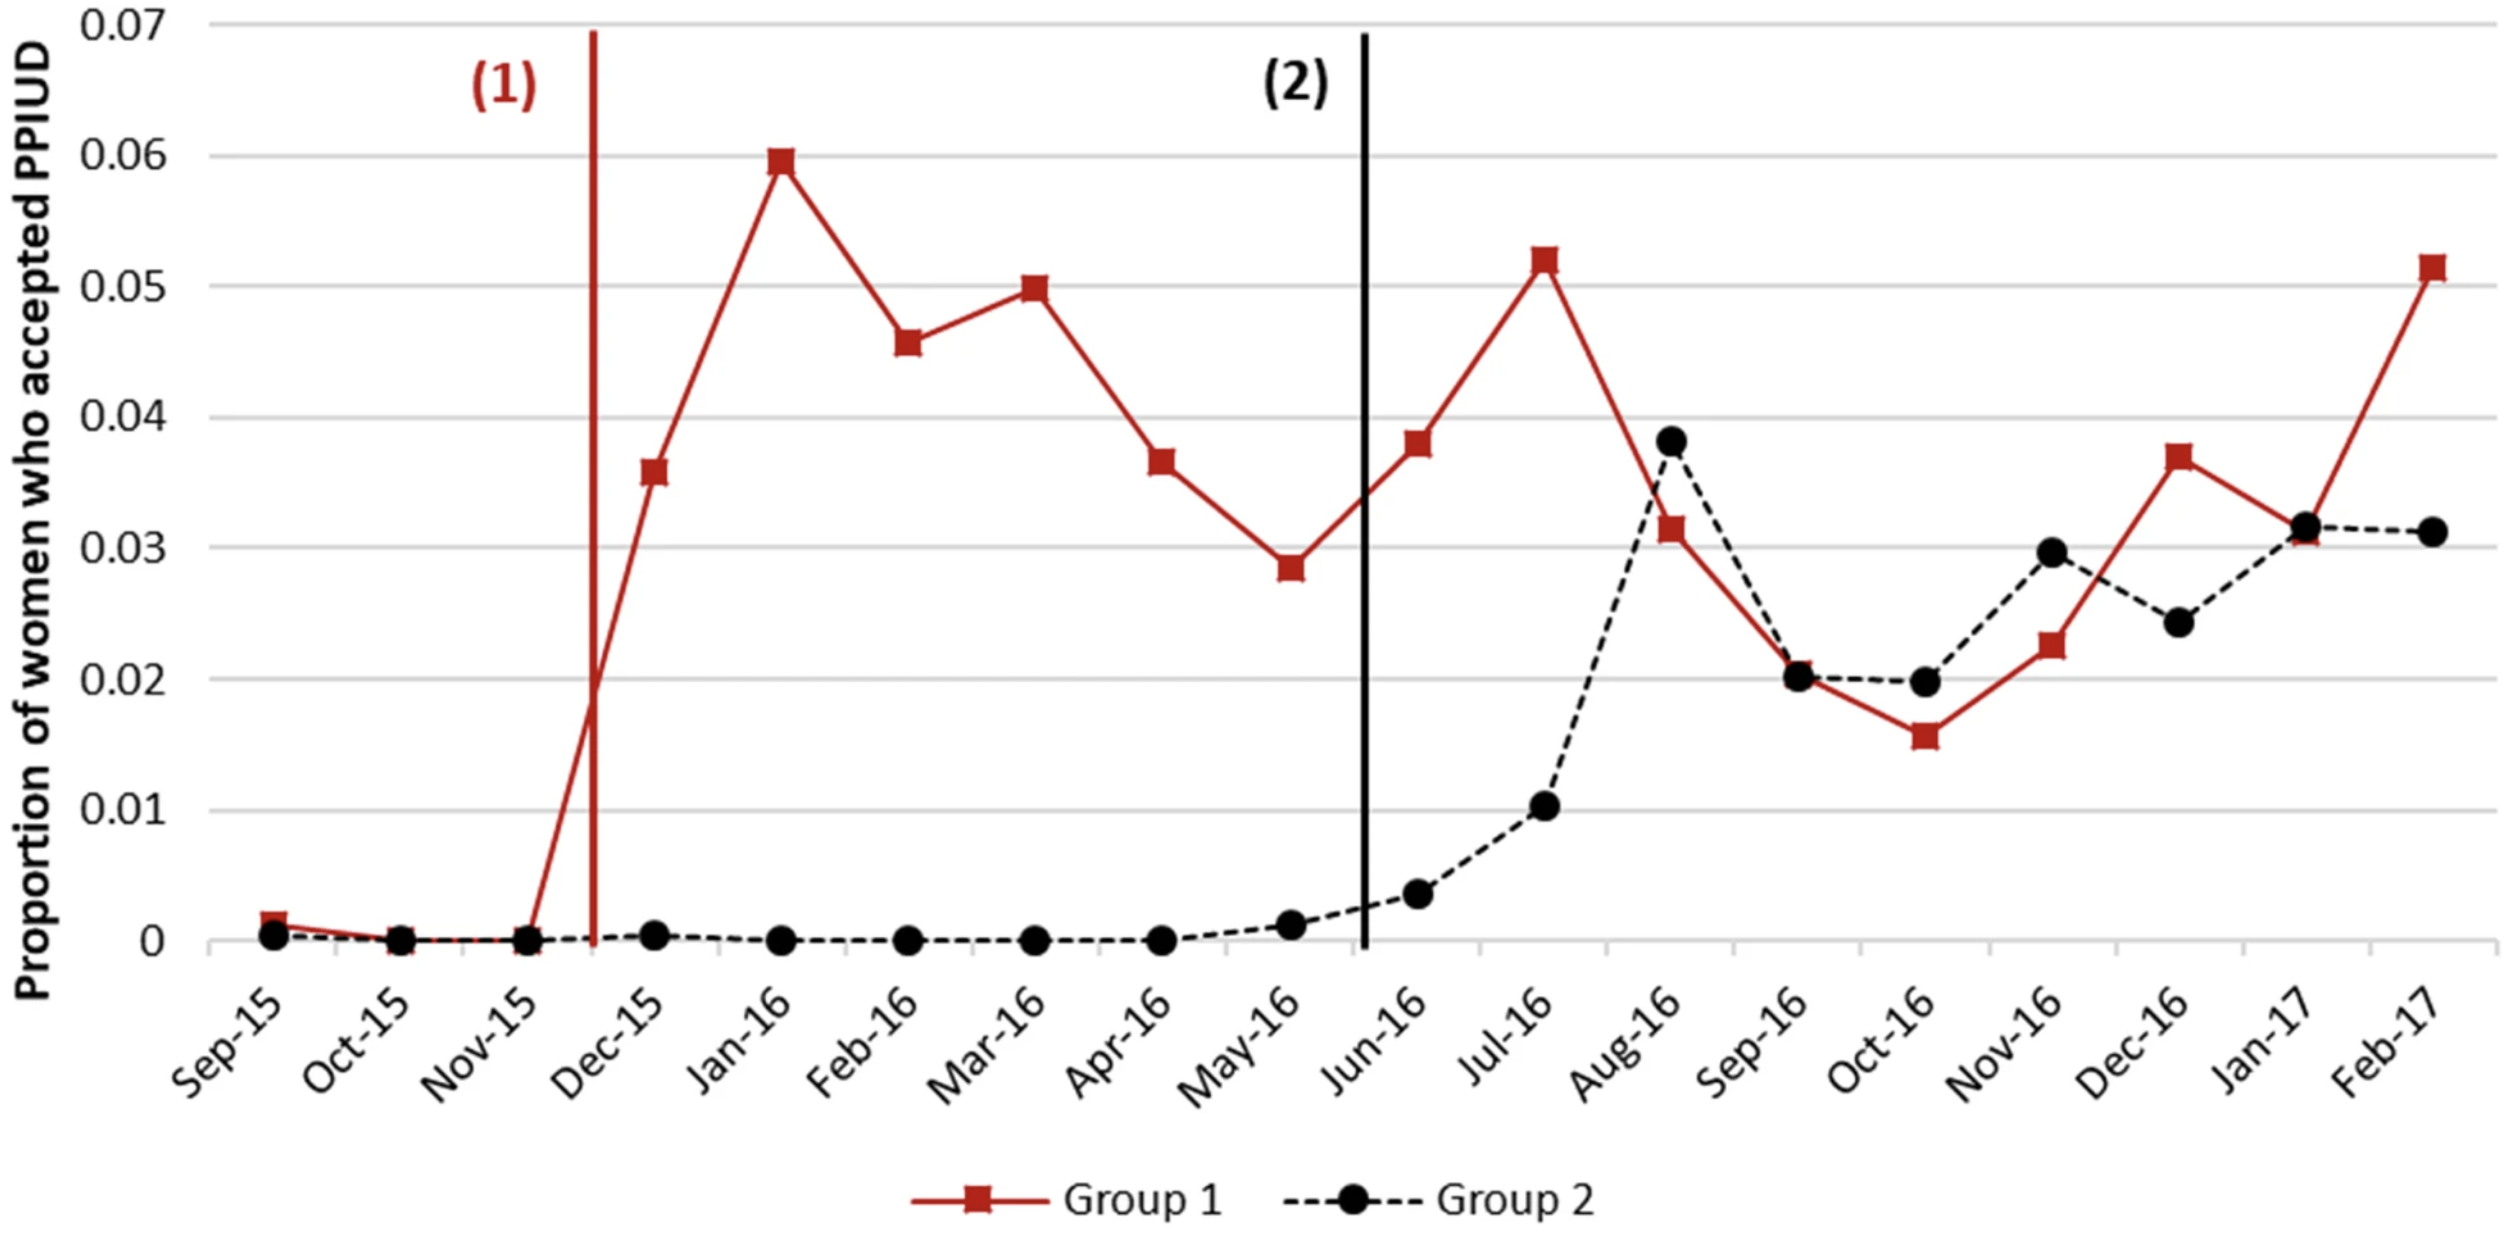
In our second example, Pradhan et al. (2019) used a stepped-wedge design to estimate the causal effect of offering postpartum family planning counseling on the proportion of new moms who opt to have an IUD inserted following childbirth. In this design, which you’ll meet more formally in Chapter 10, the counseling intervention was turned on in six hospitals in a stepwise fashion. The three hospitals randomly assigned to Group 1 received the intervention first in a staggered start. Approximately six months later, the remaining hospitals began offering the counseling intervention, one after the other. Figure 3.3 demonstrates that rates of uptake appeared to jump in each group after the intervention was introduced. The authors estimated that the intervention increased IUD uptake by 4.4 percentage points [95%CI: 2.8–6.4 pp].
PREDICT
The third common learning goal is to use data and algorithms to predict new or future observations (Shmueli, 2010). You might know this as the domain of artificial intelligence, machine learning, or deep learning. I’ll stick with the more general term of prediction modeling.
Prediction modeling has gone full rocket-launch in medicine. Data scientists who might have once worked hard for incremental gains in the quality of Netflix’s movie recommendations are now searching for ways to teach computers to outperform radiologists in detecting pathology. Increasingly, the same tools are being applied to solving public health challenges.
Returning to the topic of contraception, prediction models help us to address a key public health challenge: more than 1 in 3 women in low- and middle-income countries stop using contraception within 12 months of starting, putting them at risk for unintended and mistimed pregnancies. What if there was a way to accurately predict who would eventually discontinue and offer them additional support when starting a new method of contraception?
However, the positive predictive value of the score was only 31%. This means that most women labeled by the tool as “high risk” did not stop using a method. In practice, mislabeling women as high risk for discontinuation would be unlikely to cause harm, but it could direct scarce resources to people who don’t need additional support.
Rothschild et al. (2020) took on this question, recruiting a cohort of more than 700 Kenyan women who did not want to get pregnant and following up with them over the course of 24 weeks to see who remained on a method and who stopped. The authors used data from 75% of the women to develop a discontinuation risk score (based on things like method choice, education, marital status) and reserved the remaining 25% to validate their new tool. The authors found that discontinuation was almost 2 to 6 times higher among women labeled as high risk vs low risk.
If you have a quantitative itch to scratch, now is the time to jump in. This is a moment of real opportunity for public health–minded data scientists to shape how prediction models are developed, validated, and implemented to improve lives and strengthen health systems.
3.3 Specify a Research Question
A good research question addresses a research problem—a gap in our knowledge—and is answerable. ‘Answerable’ does not mean easy to answer, just possible to answer (Leary, 2012). The question, “Do mosquitoes have an afterlife?”, represents a gap in our knowledge, but we don’t have any empirical means for finding an answer. It’s an interesting question to pose to my kids to probe their imagination, but it’s a poor research question because it’s not answerable today.
Writing good research questions takes practice. Here are two acronyms to help you get started: FINER and PICO.
FINER
FINER stands for Feasible, Interesting, Novel, Ethical, and Relevant (Hulley et al., 2007). Use this checklist to evaluate your research questions.
Feasible: Some research questions will take a long time to answer, cost too much, require too many participants, demand skills or equipment that you do not have, or will be too complex to implement. A good research question is not just answerable, it’s feasible for YOU to answer it with the resources currently at your disposal.
Interesting: Research requires funding and effort. Without an interesting question, you won’t get funding. Without sustained interest in answering the question, you might not finish the work. Unlike some other domains, global health research tends to have long timelines, and it’s important to work on questions you’ll find interesting over the long term.
Novel: Replication is an important part of science, but the majority of global health funding goes to research that asks new and interesting questions. Therefore, you should prioritize answering questions that fill a gap in our knowledge.
Ethical: Google’s motto used to be, “don’t be evil”. This is a minimum bar for research with human subjects. You have a responsibility to ensure that the questions you ask and the methods you employ in search of answers shield participants from harm.
Relevant: In addition to being interesting, a research question should be relevant to science and society. The answer should move your field forward. Making this determination requires a thorough review of the literature and conversations with senior colleagues.
PICO
PICO stands for Population, Intervention, Comparison, and Outcome (see Table 3.1).
It’s a useful framework for asking clinical questions in particular, but it might not fit your use case. You’ll also see references to PICOT with the addition of time.
Let’s use PICO to develop a research question about the efficacy of mosquito bed nets in preventing malaria.
P: Start by defining the target population or problem that needs solving. I like to include both. For instance, we might ask a question about malaria infections (problem) among children under 5 years of age living around the Lake Victoria basin in Kenya (population).
I: This can refer to an intervention, exposure, or prognostic factor. An example of an intervention for preventing malaria infection is the provision of insecticide-treated bed nets. If you’re not conducting an intervention trial, you might be interested in an exposure that increases the risk of an outcome, such as traveling to a malaria endemic region, or a prognostic factor that predicts mortality, such as neurological dysfunction in severe cases of malaria.
C: The choice of a comparator is a critical aspect of your research question. Are you interested in comparing bed nets to another intervention, such as indoor spraying? Comparing insecticide treated bed nets to untreated bed nets? Bed nets compared to nothing? Or maybe your research question is descriptive and has no comparator. For this example, let’s say that we’re interested in the effect of treated bed nets on the outcome compared to untreated nets.
O: Outcomes are the specific targets of our investigation. For instance, we might be interested in estimating the impact of insecticide treated bed nets on parasitaemia, or the presence of malaria parasites in the blood.
We can combine these elements into a single research question:
Among children under 5 years of age living around the Lake Victoria basin in Kenya, are insecticide-treated mosquito nets more effective than untreated nets at preventing parasitaemia?
BEYOND PICO
PICO works beautifully for intervention questions, but not every research question fits this mold. Here are alternative frameworks for different types of questions:
SPIDER (Sample, Phenomenon of Interest, Design, Evaluation, Research type) is designed for qualitative research questions. Instead of populations and interventions, SPIDER focuses on the phenomenon you want to understand and how you’ll explore it. For example: “How do community health workers in rural Uganda (Sample) experience burnout (Phenomenon) as revealed through in-depth interviews (Design/Research type)?”
SPIDER was developed specifically because PICO’s intervention-comparison structure doesn’t map well to qualitative inquiry, where the goal is understanding rather than measuring effects.
PEO (Population, Exposure, Outcome) suits observational studies examining risk factors or etiology. When you’re not testing an intervention but investigating whether an exposure is associated with an outcome, PEO keeps you focused. For example: “Among pregnant women in Dhaka (Population), is household air pollution from cooking fuels (Exposure) associated with low birth weight (Outcome)?”
ECLIPSE (Expectation, Client group, Location, Impact, Professionals, Service) was developed for health services and policy questions. It’s useful when your question involves service delivery, health systems, or management decisions rather than clinical interventions.
The point isn’t to memorize acronyms—it’s to recognize that different question types benefit from different structures. Use the framework that helps you think clearly about your specific question.
3.4 Develop a Hypothesis (Maybe)
Once you have a research question, you might be tempted to jump straight to hypothesis testing. But let’s slow down and think about what a hypothesis actually is—and whether you need one.
In hypothesis testing, which we’ll address in a later chapter, you’ll learn to state a null hypothesis (no effect or no association) and an alternative hypothesis (the effect or association you expect). For now, we’re focused on the conceptual foundation.
A hypothesis is a tentative explanation or prediction that can be tested with data. In its simplest form, a hypothesis states what you expect to find. For example: “Insecticide-treated bed nets reduce malaria infection rates in children under five compared to untreated nets.” This is a testable claim. You could design a study to gather evidence for or against it.
Not every field uses the term “hypothesis” the same way. In qualitative research, you might develop “propositions” or “working assumptions” that serve a similar function but aren’t tested statistically.
But here’s something that surprises many students: not all research requires a hypothesis. Descriptive studies often don’t have one—they aim to characterize what exists, not to test a prediction. Qualitative research frequently generates hypotheses rather than testing them. And exploratory work, by definition, is looking for patterns without preconceived expectations.
Hypotheses should be specified before collecting data. HARKing (Hypothesizing After Results are Known) means constructing a hypothesis to fit patterns you’ve already found—inflating false discovery risk. Preregistration is the antidote: documenting your hypotheses and analysis plan before seeing the data.
So when do you need a hypothesis? Generally, when your goal is causal inference, when you’re testing a specific prediction derived from theory, or when you want to examine an association. If you’re asking “Does X cause Y?”, “Is treatment A better than treatment B?”, or “Is exposure C associated with outcome D?”, you should have a hypothesis.
HYPOTHESES MUST BE FALSIFIABLE
A hypothesis isn’t just any prediction—it must be falsifiable. This means it must be possible, at least in principle, to find evidence that would prove it wrong.
Consider two statements:
- “Insecticide-treated bed nets reduce malaria infections.”
- “Bed nets are helpful for malaria prevention.”
The first statement is falsifiable. We can design a study, collect data, and potentially find that treated nets don’t reduce infections—or that they do. Either way, the evidence speaks to the claim. The second statement is not falsifiable. It’s too vague to test: helpful how? Reduce infections? Reduce severe disease? Reduce vector bites? Under what conditions? Over what timeframe?
When you develop a hypothesis, ask yourself: What evidence would convince me I’m wrong? If you can’t answer that question, you don’t have a scientific hypothesis.
THE ROLE OF THEORY
Good hypotheses don’t emerge from thin air. They’re grounded in theory—an explanation of how and why things work the way they do. Theory tells you what to expect and why. Without theory, a hypothesis is just a guess.
Consider the bed net example. Why would we expect insecticide-treated nets to reduce malaria more than untreated nets? Because malaria is transmitted by mosquitoes, insecticides kill mosquitoes, and dead mosquitoes can’t transmit disease. This causal chain—this theory—gives us reason to believe the hypothesis is plausible. It also helps us understand what we’re really testing: not just whether treated nets “work,” but whether the mechanism we’ve proposed (killing mosquitoes) produces the expected outcome (fewer infections).
When you develop a hypothesis, ask yourself: What’s the theory behind this prediction? If you can’t articulate one, you might be fishing for results rather than testing a meaningful claim.
3.5 Closing Reflection
Remember that terrifying moment when a mentor asks, “What are your ideas?” You now have a framework for answering that question. No need to hyperventilate!
Good ideas rarely arrive as eureka moments; they emerge slowly, through exposure and connection, as you explore the adjacent possible. You now have the building blocks for designing a study: a research problem, a learning goal, a research question, and—when appropriate—a hypothesis grounded in theory. But a well-crafted question is only the beginning. In the chapters that follow, we’ll turn these ideas into action—searching the literature, designing studies, collecting data, and making sense of what we find.
Bhatt, N. et al. (2021). Perceptions of family planning services and its key barriers among adolescents and young people in eastern nepal: A qualitative study. PloS One, 16(5), e0252184.
Fox, M. P. et al. (2022). On the need to revitalize descriptive epidemiology. American Journal of Epidemiology.
Gelman, A. et al. (2020). Regression and other stories. Cambridge University Press.
Hulley, S. et al. (2007). Getting started: The anatomy and physiology of clinical research (S. Hulley et al., Eds.; Third, pp. 3–15). Lippincott Williams & Wilkins.
Leary, M. (2012). Introduction to behavioral research methods (6th ed.). Pearson.
Ministry of Health and Population et al. (2011). Nepal Demographic and Health Survey 2011. Ministry of Health; Populationh.
Pradhan, E. et al. (2019). Integrating postpartum contraceptive counseling and IUD insertion services into maternity care in nepal: Results from stepped-wedge randomized controlled trial. Reproductive Health, 16(1), 69.
Rothschild, W., Claire et al. (2020). A risk scoring tool for predicting Kenyan women at high risk of contraceptive discontinuation. Contraception, 2, 100045.
Shmueli, G. (2010). To explain or to predict? Statistical Science, 25(3), 289–310.
Wu, W.-J. et al. (2020). Community-based postpartum contraceptive counselling in rural nepal: A mixed-methods evaluation. Sexual and Reproductive Health Matters, 28(2), 1765646.